Visualisation of the Q-learning reward propagation
Hello everyone 🙂
In this post I will try to give you a better intuition on how the positive and negative rewards are propagated in the Q-table of the Q-Learning algorithm.
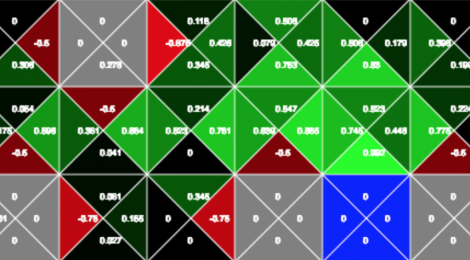
Lets start by looking at an interactive Q-table visualisation:
This visualisation represents the Q-Table of the Q-learning algorithm. As we know the Q-Table holds the values of actions-state pairs, and as we can see from above the table is holding 4 values (representing the four actions up, down, left, right) for each square of the grid. Therefore each of the numbers on the grid represents the value of taking an action from a given state.
Try moving the actor (red square) towards the goal (blue square). You will notice that when you are one step from the goal and take the action to reach the goal, the value of the down action form the penultimate state is updated to 0.5
This value is obtained from the Q-value update formula:
![]()
This formula can be interpreted as follows:
newVal = oldVal + learningRate * (reward + discount_val * maxValOfNextState – oldVal)
Now let’s look at how the rewards are propagated in the table and how these values are used by the agent to reach its target.
If we move the red agent toward the goal again, we can see that the third to last value is also updated. This is because when we move from the third-to-last to the second-to-last state, we use the formula given above and the 0.5 gets discounted and propagated back. If you try moving around a little more you will see that the reward values are slowly propagated back, but what about the negative rewards. If you try to move the agent into one of the black squares, you will see that a negative value is associated to the actions that lead to the negative reward. But no matter how many times the black squares are visited, the negative rewards only affect the state that is immediately connected to the bad state.
Why aren’t the negative values propagated back into the table? This behaviour is given by the fact that the Q-value update formula uses a max value. When the algorithm is computing the Q-value for a state-action pair, it looks at all the possible actions in the next state and uses the max value to perform the update. Negative values (being smaller than zero) will always be ignored by the update function and only positive rewards get are used to strengthen the path to the goal.